
The Veeder Bowl
Luka Catipovic · August 2026
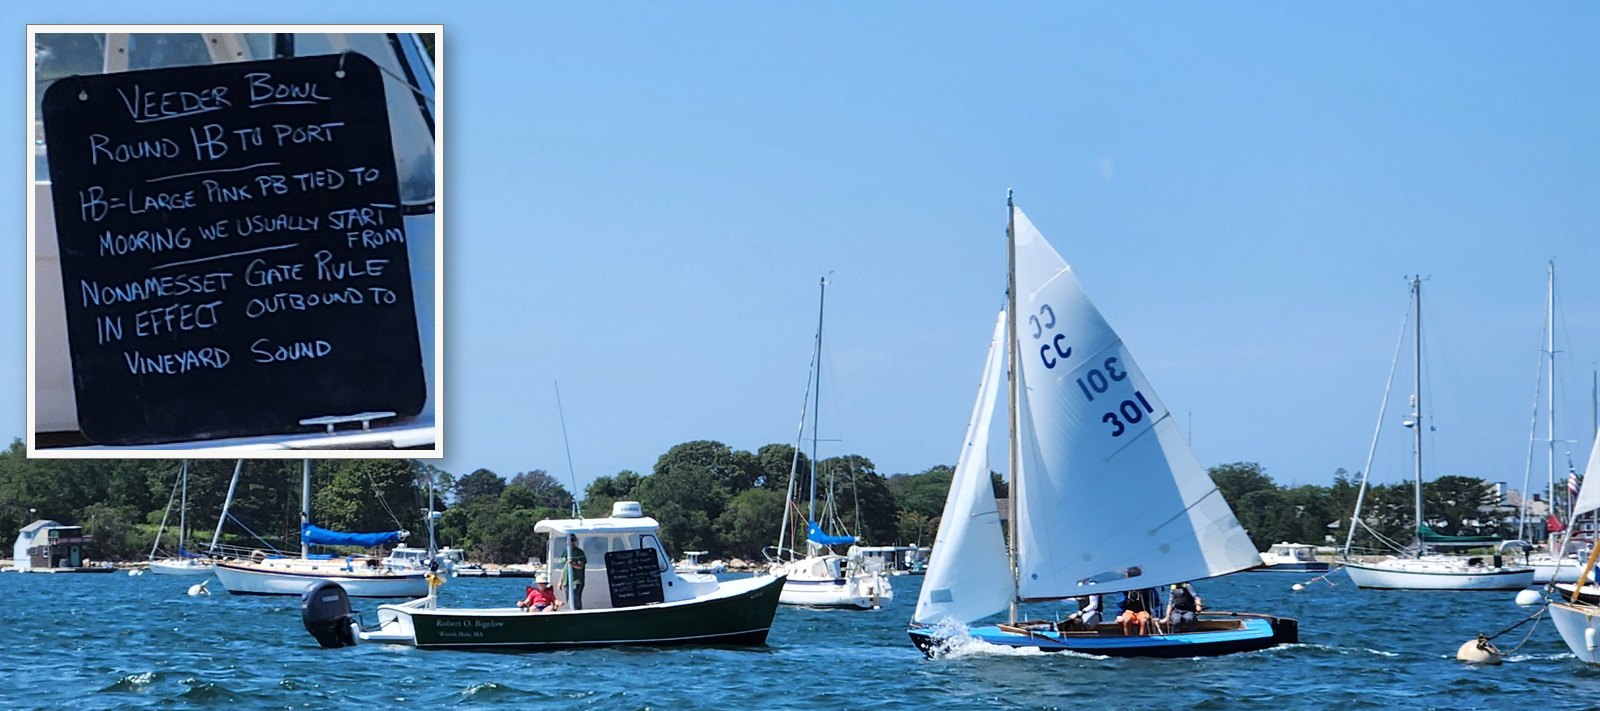
The Veeder Bowl is a sailing race around Naushon Island with no rule as to which direction to take. Participants compete over the 17 nm course aboard Cape Cod Knockabouts, a fiberglass centerboard racing one-design designed in 1925 by Captain Charles S. Gurney (Figure 1). The race is hosted annually by the Woods Hole Yacht Club in Woods Hole, Massachusetts, and this writeup follows the race that took place on August 8, 2026.
This year, five boats participated: Rumblefish, Who’s There, Ghost, Blue Bayou, and Jilt. Rumblefish finished first in just under four hours, with Who’s There sixteen minutes back, and Ghost twenty-two. Jilt retired partway down the Sound, and Blue Bayou suffered a rudder failure in Robinsons Hole and its GPS recorded only thirteen fixes. This writeup examines the quantifiable aspects of their race tracks, along with what role tidal currents played in their decision making and in the result.
The race starts in Great Harbor, Woods Hole, and circumnavigates the islands of Nonamesset, Uncatena, and Naushon (Figure 2). Currents in this area regularly exceed 5 knots and wind predictably blows from the southwest. Robinsons Hole is the turnaround point, making the race roughly 17 nautical miles depending on track.
All five chose to navigate around the islands clockwise. Clockwise here means out through the Woods Hole passage, southwest down Vineyard Sound, through Robinsons Hole, and home along Buzzards Bay. Winds were steady between 12 and 15 kn with gusts up to 20 kn throughout the period of the race (Figure 3, Figure S2). The clockwise route resulted in beneficial southwest currents up to 1.8 kn during the upwind beat, and beneficial currents up to 0.5 kn during the downwind run (Figure 4, Figure 5). At the turnaround point, Robinsons Hole, the slack tide was at 14:15 EDT, after which currents exceeded 2 kn against the course. This created a critical time gate for each boat to aim for.
The tidal current was projected onto each boat’s course over ground and integrated over time to give distance gained from current (Figure 6). All three boats gained upwards of 0.75 nm in distance from current alone during the beat. However, no boats were able to make it to Robinsons Hole for the time gate, resulting in a roughly 30% loss in the distance they had just earned. This loss was least for Rumblefish, who entered at 14:43 EDT, and greatest for Ghost, who did not enter until 15:00 EDT. Over the full race, the net distance gained from current was +0.96 nm for Ghost, +1.20 nm for Who’s There, and +1.23 nm for Rumblefish, with the current favorable for 67%, 72%, and 75% of each boat’s race, respectively. Rumblefish passed through the gate 28 minutes after slack and lost 0.28 nm to adverse current over its race, while Ghost passed through 45 minutes after slack and lost 0.47 nm. The timing of this passage was the most consequential current-related decision of the race. After slack, the flood tide pours back through Robinsons Hole against the course, so every minute late is a minute sailed against strong detrimental current. Currents throughout this analysis are from the tidal model the Actual Currents app runs on, which reproduces NOAA’s own predictions from acoustic Doppler current profiler (ADCP) measurements in the passages this race turns on to within 10 to 20 percent on peak flow and a few minutes on timing (Figure S1).
During the downwind run, beneficial currents allowed each boat to regain lost distance, with Ghost and Who’s There having faster runs than Rumblefish. Upon entering the Woods Hole Passage at the end of the track, currents became the dominant contribution to speed, with each boat exceeding 9 kn, which is faster than hull speed for the Knockabouts.
| Boat | Gained (nm) | Lost (nm) | Net (nm) | Time favorable |
|---|
Along with distance gained from current, tracks for each boat were also broken down into route, which was the total distance each boat traveled, and pace, which is the speed they traveled at (Figure 7). Rumblefish finished 22 minutes before Ghost, 15 of which is explained by taking a more direct route, 4 minutes are explained by current, and only 3 minutes are explained by pace, indicating that Rumblefish sailed at a similar speed as Ghost for the race, but sailed a much shorter distance. Rumblefish finished 16 minutes before Who’s There but sailed a longer route; 18 minutes of the lead were explained by pace. Compared directly, Ghost sailed roughly sixteen minutes faster through the water than Who’s There, but sailed approximately two additional miles of distance, resulting in a net deficit of five and a half minutes (Figure 7c).
Removing the current impact from each boat’s track allowed for measuring speed through water at each boat’s true wind angle (TWA; Figure 8). Each knockabout sailed fairly similar polars with Who’s There consistently pointing highest into the wind. Who’s There held a close-hauled angle of roughly 49 degrees, against 51 to 52 degrees for the other two finishers. That pointing explains Who’s There’s shorter route and its larger share of current on the beat. Overall fleet speeds peaked near 5.6 kn at a true wind angle of 155 degrees, with close-hauled speeds near 4.5 kn. (Speed through water is GPS motion minus the modeled current, so model error smears a few samples to angles no boat can sail.)
Tack angle, beat leg, and time lost per tack were also extracted from the GPS tracks of each boat (Figure 9). All three are measured through the water, with the modeled current removed first. A tack is a swing of at least 50° in the through-water heading, the tack angle is the size of that swing, and the beat leg is the distance sailed between one tack and the next. Time lost per tack compares the boat’s speed coming out of the turn with its own pace going in and adds up the shortfall until the boat is back up to speed, expressed as seconds of full-pace sailing given up. Across the finishers, median beat legs ranged from 0.61 nm for Ghost to 0.75 nm for Who’s There, and median time lost per tack from 5.9 to 8.3 seconds, over 11 to 15 tacks each. Speed through the water on the beat is measured the same way, over samples 40 to 80° off the wind so the boats are compared on the same points of sail. Who’s There sailed the beat about ten percent slower through the water than Ghost or Rumblefish. Jilt was the quickest of the four through the water over its shorter record but gave its ground away tacking. Downwind the three finishers were nearly identical, within about two percent of each other through the water, so the pace that separated them was an upwind matter. It also means the differences between their runs down the back of the island came from current and route rather than from boat speed. Velocity made good (VMG) is the component of a boat’s speed in the direction of the wind, which is what shortens a beat. Ghost, Who’s There, and Rumblefish made between 2.4 kn and 2.7 kn toward the wind. Jilt made 1.7 kn. That is the clearest single account of its race, the fastest of the four through the water and the slowest toward the mark, holding a median 69° off the wind where the finishers held 51 to 54°.
Steering steadiness on the run is measured as how far each boat’s through-water heading wandered inside a two-minute window, with gybes excluded, and Ghost’s moved about twice as much as the other two, 3.7° against 1.6° and 1.8° for Who’s There and Rumblefish, respectively. The extra distance that costs is negligible, a few hundredths of a mile across the whole run, so it is a signature of how a boat was steered rather than a penalty.
Which leaves the afternoon’s big question: everyone chose clockwise, was that the right call? The measured traits were used to build an ensemble of simulated sailors that race both ways around the islands. There are 12 simulated skippers with 4 sets of traits and 3 pace scalings to account for variability in speed introduced by faster or slower crews. The scalings are set by the real boats: measured on the same points of sail, the four boats’ upwind speed spanned 0.91 to 1.07 of the fleet average, so sweeping ten percent either way covers crews a little slower and a little faster than any that raced that day. Each simulated sailor also draws their own tacking style from the measured tracks (short boards or long ones, tight to the line or swinging wide), so the ensemble covers the spread of strategies a real fleet shows (Figure 10). Every one of the twelve pairings finishes clockwise ahead, by fifteen to twenty-seven minutes. But re-sailing the whole ensemble from other gun times shows that had the start occurred 30 minutes later than it did, counter-clockwise would have been the better choice (Figure 11). Notably, the start of this race had already been delayed by nearly thirty minutes, meaning the fleet’s unanimous choice, while correct at the actual gun, was considerably closer to the crossover point than anyone on the water likely realized. At full pace, the simulated clockwise boats finished within roughly ten minutes of the real boats’ elapsed times, suggesting these simulations are a reasonable representation of the actual race.
Current is hugely important in determining which direction to sail around the island in this race. Just an hour difference in tidal conditions can change this decision and a 30-minute delay in race start can make the choice considerably less obvious. Route selection within a direction can also decide the race between sailors of equal ability. Optimizing time spent in beneficial currents can generate significant leads compared to routes where time was spent in mild or detrimental currents. Both effects are measurable in this race, and the timing of arrival at Robinsons Hole determined how much of the roughly one nautical mile earned from the current on the beat each boat kept.
Not every boat in the clockwise group beat every boat in the counter-clockwise group. In these simulations, the fastest counter-clockwise boat finished nearly fifty minutes ahead of the slowest clockwise boat, despite sailing the less favorable direction. This spread shows that the direction decision sets only part of the outcome, differences in route and pace within each direction produced separations larger than the direction advantage itself, and much of that separation traces directly to how each route interacted with the current.
Supplementary: validating the modeled currents and wind
The currents under this analysis are a model field, so they deserve a check against something real. Five stations inside the frame carry their own analysis of a real ADCP deployment, all of them from NOAA’s 2009 Buzzards Bay current survey, and they sit in exactly the passages this race turns on. Figure S1 runs the model against NOAA’s published prediction at each one through race day.
The agreement is close where it matters. In the three passages the fleet actually sailed, the model reproduces the shape of the curve and its timing, running 11 to 21 percent strong on peak flow, with a scatter of 0.3 to 0.8 kn and a lag of 0 to 12 minutes. Comparing the tidal constants themselves, constituent by constituent, which is how tidal databases are normally scored, the dominant M2 tide is right to 2.2 degrees of phase, about four and a half minutes, with the larger errors confined to the small diurnal constituents and the overtides that shape the asymmetry of the curve rather than its peaks. In short, the model is a few percent strong and a few minutes late, and neither is enough to move the conclusions this post draws from it.
The wind deserves the same treatment. Two stations bracket the course: the Buzzards Bay Entrance Tower (BUZM3), fifteen kilometers southwest of the frame in open water, and the yacht club’s own weather station (WHYC) at the head of Great Harbor, two hundred meters northeast of the start line. Tower speeds are reduced from the 24.8 m anemometer to 10 m equivalent by the power-law adjustment the National Data Buoy Center (NDBC) publishes (Hsu, Meindl & Gilhousen 1994); the club station’s speeds are plotted as reported, and gusts stay at anemometer height. Over eleven hourly pairs HRRR ran about a knot and a half light at both stations (a root-mean-square error, RMSE, of 2.5–2.6 kn) with direction right to a few degrees. The sea breeze’s geometry was right, its strength slightly understated.